Didactics and Technology in Education
107.6K views | +0 today
Follow
Didactics and Technology in Education
Almost "everything" about new approaches in Education
Your new post is loading...
Rescooped by Rui Guimarães Lima from visual data
Scoop.it!

50 Well-Designed Infographics About Design

50 Well-Designed Infographics About Design | Didactics and Technology in Education | Scoop.it

Here are another roughly 6,000 words of design facts, figures, and information contained in an article of only 600 words. In other words, this article is bigger on the inside than it is on the outside.

Alas, it’s still too small to contain all the well-designed infographics about graphic design, web design, photography, freelancing, and, of course, infographic design.


Each thumbnail links to the full-sized graphic on its original Website. For your convenience we’ve made each of those links pop open in a new tab or window. To return here, simply close that tab or window.


Via Lauren Moss
Jay Stevens's comment, March 9, 2013 6:44 PM
this one is packed with so much useful stuff—thanks!
Rescooped by Rui Guimarães Lima from Pedalogica: educación y TIC
Scoop.it!

All You Need to Know About Infographics: Tips, Tutorials, Guides

All You Need to Know About Infographics: Tips, Tutorials, Guides | Didactics and Technology in Education | Scoop.it

Let’s be honest, we don’t like to read big pieces of text. Text-heavy graphs are rather difficult for understanding, especially when dealing with numbers and statistics. That is why illustrations and flowcharts are often used for such kind of information.

An infographic, or a visual representation of study or data, like anything else, can be done right or wrong. How to create a successful infographic? A good idea and a good design.


Stop by the link for more on what defines an infographic, what contributes to its popularity, as well as the various types of infographics and references for tutorials and best practices.


Additional topics covered include:

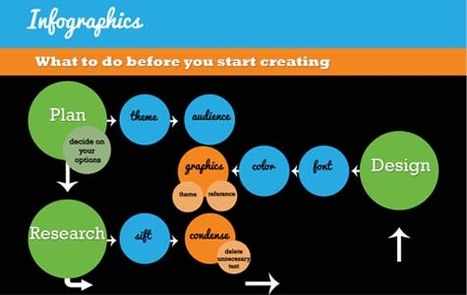
The major parts of an infographic How to create an infographic Developing ideas & organizing data Research & sources Typography, graphics & color Facts & conclusions Designing & Editing


Via Lauren Moss, Monique Walhof, THE OFFICIAL ANDREASCY, Jimi Paradise, Alazne González
HCL's curator insight, April 30, 2014 9:26 PM

Some good tips here...