
"One of last year's most popular posts featured my chart comparing seven popular blogging tools for teachers and students. Given the ..."
Via Leona Ungerer
Get Started for FREE
Sign up with Facebook Sign up with X
I don't have a Facebook or a X account


 Your new post is loading...
 Your new post is loading...
Your new post is loading...
"One of last year's most popular posts featured my chart comparing seven popular blogging tools for teachers and students. Given the ..." Via Leona Ungerer 
No comment yet.
Sign up to comment
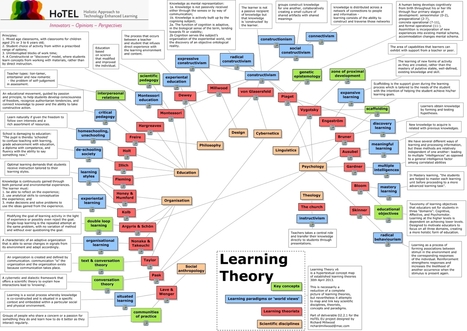
This Concept Map, created with IHMC CmapTools, has information related to: Learning Theory v5, Organisation Kolb, Psychology Vygotsky, Psychology Bloom, Piaget genetic epistemology, Psychology Skinner, Montessori constructivism, Dewey constructivism, radical constructivism Knowledge as mental representation: 1a. Knowledge is not passively received either through the senses or by way of communication; 1b. Knowledge is actively built up by the cognising subject; 2a. The function of cognition is adaptive, in the biological sense of the term, tending towards fit or viability; 2b Cognition serves the subject’s organization of the experiential world, not the discovery of an objective ontological reality., social constructivism connectivism, Taylor Organisation, Holt homeschooling, unschooling, constructivism radical constructivism, Kolb experiental learning, Montessori Montessori education, Social anthropology Lave & Wenger, Vygotsky zone of proximal development, Lave & Wenger situated learning, Education Illich, scientific pedagogy Education based on science that modified and improved the individual., communities of practice Groups of people who share a concern or a passion for something they do and learn how to do it better as they interact regularly. Via Dr. Susan Bainbridge

Lyn Hogan's curator insight,
April 1, 2014 5:28 AM
The value of this concept map is how it diagrammatically illustrates the association between the various learning theories and the differences between the approaches . A diagram of this type represents a large amount of data /information presented in a simple way . This is particularly important to visual learners 
JulieLaRoche's curator insight,
April 12, 2014 11:00 AM
I love infographics like this that depict the 10,000 foot view to show the overall subject, the various theories or parts, and how the pieces fit together and influence one another. |
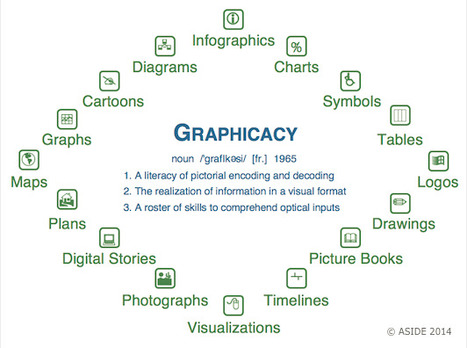
"In the scholastic world's quest to pinpoint new "literacies," one of the most essential skills in a student's toolkit isn't new at all. "Graphicacy" is the vital proficiency with visual inputs that all learners must master in the modern classroom. Graphicacy refers to the encoding and decoding of images, particularly in the close examination of details that construct visual meaning. It stands with literacy, oracy, and numeracy as one of the four indispensable corners of education." Via Beth Dichter

Beth Dichter's curator insight,
March 29, 2014 8:40 PM
In education we talk about a variety of literacies, and one that comes up more often today is visual literacy, which may also be referred to as graphicacy. This post explores this concept providing a historical perspective as well as links to a number of excellent resources. There are also many visuals with the post, including the one above that looks at the many forms of graphicacy that we see in our classrooms (and provides a number of definitions). Many of these forms may be created by students using technology. There is also a short video, To Understand is to Perceive Patterns, that looks at how patterns in nature are repeated.

Ignacio Sáenz de Miera's curator insight,
April 22, 2013 5:18 PM
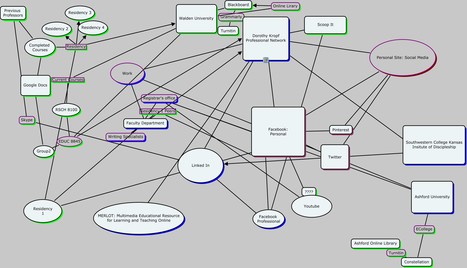
"...my networks have changed the way I learned... ª Yes, so have mine... Thanks! |