Research and publish the best content.
Get Started for FREE
Sign up with Facebook Sign up with X
I don't have a Facebook or a X account
Already have an account: Login

El rincón de mferna
110.4K views |
+0 today

Curando la curiosidad incurable... Matando fiebre ;)
Curated by
Mariano Fernandez S.
 Your new post is loading...
 Your new post is loading...
Your new post is loading...
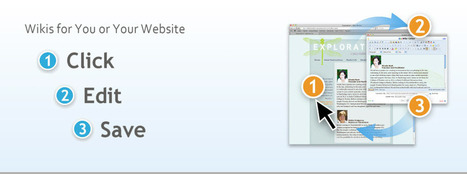
dooWikis allow users to easily add or embed wikis into their website or host their wikis on dooWikis.com, all for free! Via juandoming 
|

Campus Extens - UIB Virtual -'s curator insight,
January 10, 2014 5:38 AM
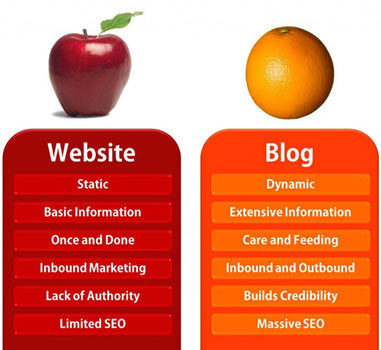
El post següent presenta de manera clara i visual les diferències entre un lloc web i un blog, i aporta suggeriments sobre com emprar l’un i l’altre. 
Neil Ferree's curator insight,
February 1, 2014 9:15 AM
Read this article by [url=/u/129000 x-already-notified=1]Martin (Marty) Smith[/url] if you 're tossing with which path to proceed with? I'm in favor of WordPress responsive website for its Social SEO prowess and mobile adaptibility and publishing power. 
Jonathan Ginsberg's curator insight,
February 1, 2014 2:16 PM
I build my websites in Wordpress and include a blog component - the best of both worlds.

From simple charts to complex maps and infographics, Brian Suda's round-up of the best – and mostly free – tools has everything you need to bring your data to life... A common question is how to get started with data visualisations. Beyond following blogs, you need to practice – and to practice, you need to understand the tools available. In this article, get introduced to 20 different tools for creating visualisations... Via Lauren Moss, Baiba Svenca, Jenny Pesina

Randy Rebman's curator insight,
January 28, 2013 12:33 PM
This looks like it might be a good source for integrating infographics into the classroom. |