Your new post is loading...

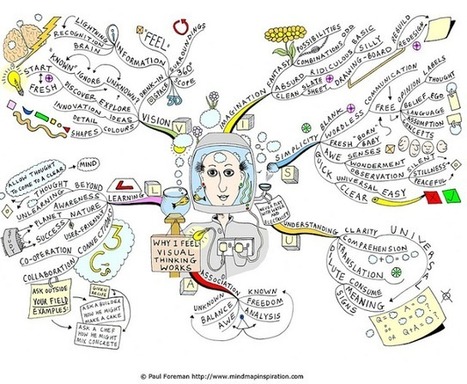

I think most of us are visual learners .We love infographics and diagrams that present data in a visually attractive way and we probably find it easier to process and internalize such data. Over the last couple of years I have been sharing several awesome graphics covering a wide range of topics from language mechanics to higher order thinking skills. The archive is open to everybody to access and I welcome your contributions and feedback on it as well.