


A publication by MIT's J-PAL North America analyzes 126 rigorous studies to help decision-makers understand how education technology can help or hinder student learning.
Via Nik Peachey
Get Started for FREE
Sign up with Facebook Sign up with X
I don't have a Facebook or a X account


 Your new post is loading...
 Your new post is loading...
Your new post is loading...
A publication by MIT's J-PAL North America analyzes 126 rigorous studies to help decision-makers understand how education technology can help or hinder student learning. Via Nik Peachey 
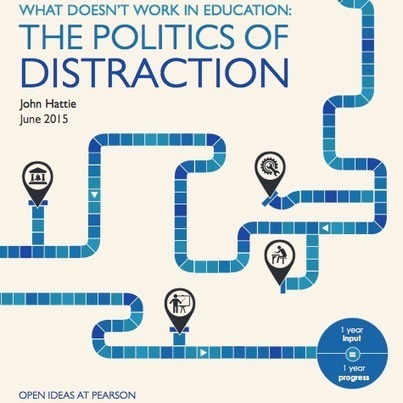
You can download John Hattie's new study "What Doesn't Work in Education: The Politics of Distraction". It's free and licensed under the Creative Commons.
|
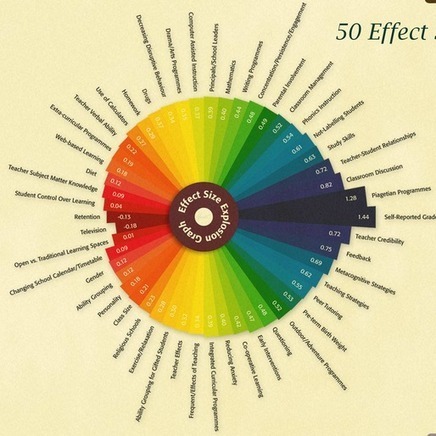
“ Terry Burr designed that beautiful educational infographic for Osiris Educational and Visible Learning Plus. The infographic is based on data from John Hattie’s research and the work of the Visible Learning Plus team. (c) www.osiriseducational.co.uk / www.visiblelearningplus.co.uk Visible Learning Infografik Visible…Read more ›”
Via Ana Cristina Pratas, massimo facchinetti, malek, Stephania Savva, Ph.D, Sarantis Chelmis, NikolaosKourakos

Gust MEES's curator insight,
July 1, 2017 7:16 AM
Terry Burr designed that beautiful educational infographic for Osiris Educational and Visible Learning Plus. The infographic is based on data from John Hattie’s research and the work of the Visible Learning Plus team. (c) www.osiriseducational.co.uk / www.visiblelearningplus.co.uk Visible Learning Infografik Visible…Read more ›
Learn more / En savoir plus / Mehr erfahren:
http://www.scoop.it/t/21st-century-learning-and-teaching/?&tag=John+HATTIE

Margarita Saucedo's curator insight,
July 3, 2017 10:50 AM
Ejemplo de Infografía:un apoyo visual para la enseñanza
|


Useful reading.