Your new post is loading...

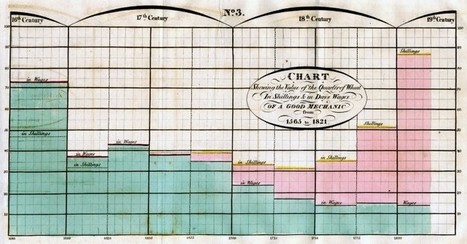

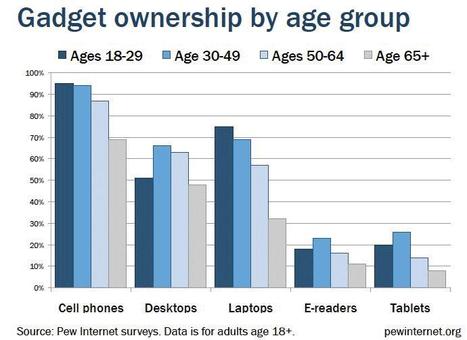
'In our Data Visualization 101 series, we cover each chart type to help you sharpen your data visualization skills.
Bar charts are a highly versatile way to visually communicate data. Decidedly straightforward, they can convey the message behind the numbers with impact and meaningful clarity, making complex data easy to understand at a glance.'
Via Lauren Moss