A forward-looking lesson plan predicted that "computers will soon play as significant and universal a role in schools as books do today"
Via Ana Cristina Pratas
Get Started for FREE
Sign up with Facebook Sign up with X
I don't have a Facebook or a X account


 Your new post is loading...
 Your new post is loading...
Your new post is loading...
A forward-looking lesson plan predicted that "computers will soon play as significant and universal a role in schools as books do today" Via Ana Cristina Pratas 
No comment yet.
Sign up to comment
"Calculators have come a long way since the first ones that could add, subtract, multiply, and divide. Now, for a modest cost, it’s possible to purchase a graphing calculator. Or, with your computer, you can put a free one in your browser." Via Beth Dichter

Beth Dichter's curator insight,
July 29, 2014 9:13 PM
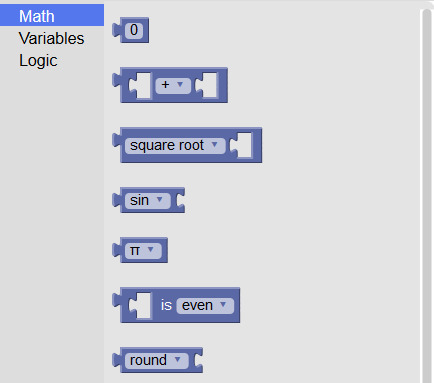
Have you considered a different option? What about a block graphic calculator? This now a common way to teach coding, having students connect blocks together to build code. Blockly has a free online block calculator that provides math (a portion of the options are shown in the image), variables and logic. To the left side of the coding is the graphing calculator. This type of calculator may help visual learners who may more easily create formulas through the use of blocks. Check it out at Blockly. |
Computer scientist reviews frontier technologies to determine fundamental limits of computer scaling
From
phys

From their origins in the 1940s as sequestered, room-sized machines designed for military and scientific use, computers have made a rapid march into the mainstream, radically transforming industry, commerce, entertainment and governance while shrinking to become ubiquitous handheld portals to the world. This progress has been driven by the industry's ability to continually innovate techniques for packing increasing amounts of computational circuitry into smaller and denser microchips. But with miniature computer processors now containing millions of closely-packed transistor components of near atomic size, chip designers are facing both engineering and fundamental limits that have become barriers to the continued improvement of computer performance. Have we reached the limits to computation?
In a review article in this week's issue of the journal Nature, Igor Markov of the University of Michigan reviews limiting factors in the development of computing systems to help determine what is achievable, identifying "loose" limits and viable opportunities for advancements through the use of emerging technologies. His research for this project was funded in part by the National Science Foundation (NSF).
"Just as the second law of thermodynamics was inspired by the discovery of heat engines during the industrial revolution, we are poised to identify fundamental laws that could enunciate the limits of computation in the present information age," says Sankar Basu, a program director in NSF's Computer and Information Science and Engineering Directorate. "Markov's paper revolves around this important intellectual question of our time and briefly touches upon most threads of scientific work leading up to it."
The article summarizes and examines limitations in the areas of manufacturing and engineering, design and validation, power and heat, time and space, and information and computational complexity. Via Jocelyn Stoller, Dr. Stefan Gruenwald, Miloš Bajčetić

From simple charts to complex maps and infographics, Brian Suda's round-up of the best – and mostly free – tools has everything you need to bring your data to life. A common question is how to get started with data visualisations. Beyond following blogs, you need to practice – and to practice, you need to understand the tools available. In this article, get introduced to 20 different tools for creating visualisations. Via Lauren Moss, Baiba Svenca, Goulu, Tudor Cosmatu

Randy Rebman's curator insight,
January 28, 2013 12:33 PM
This looks like it might be a good source for integrating infographics into the classroom. |