Education 2.0 & 3.0
148.5K views | +1 today
Follow
Education 2.0 & 3.0
All about learning and technology
Curated by Yashy Tohsaku
Your new post is loading...
Rescooped by Yashy Tohsaku from Into the Driver's Seat
Scoop.it!

Real Life Infographics That Brilliantly Visualize Data Using Physical Objects

Real Life Infographics That Brilliantly Visualize Data Using Physical Objects | Education 2.0 & 3.0 | Scoop.it

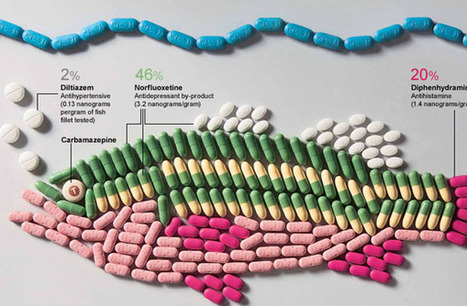
A look at infographics that brilliantly display data using physical objects, a technique that can simplify information. 
Visit the original list by Freeyork for more, including a pie chart made from actual thanksgiving pies, information about water usage and fast food visualized with handmade paper objects and stacks of sugar cubes depicting the amount of sugar in food and drinks, among others.


Via Lauren Moss, Jim Lerman
Marco Favero's curator insight, April 5, 2015 5:45 PM

aggiungi la tua intuizione ...

Davies Blake's curator insight, May 28, 2020 1:40 PM
buy stiizy pod

buy smartbuds

buy pre rolls 10

thca diamonds free!!

facts of white widow

Foreverkush.com has a 30% discount going on from 1st till the 15th of April due to the outbreak of corona virus. please stay home place, your orders
Rescooped by Yashy Tohsaku from Professional Learning for Busy Educators
Scoop.it!

Two Free Apps for Capturing Immersive Imagery - Free Tech 4 Teachers 

Two Free Apps for Capturing Immersive Imagery - Free Tech 4 Teachers  | Education 2.0 & 3.0 | Scoop.it
In 5 Good Resources for Teaching and Learning About World War II I mentioned that I captured some photospheres at the WWII Museum in New Orleans. I created those photospheres for use in virtual reality viewers. The tools that I used for creating those photospheres were the Google Cardboard Camera app and the Google Street View app. Both apps are available for Android and iOS.

Via John Evans
No comment yet.